

Revenue per Email: Calculate, Benchmark, and Improve It
What is revenue per email and how do you calculate it?
Revenue per email (RPE) is the average amount of revenue your business generates from every single email you send. It’s one of the most direct financial metrics in email marketing, and it cuts through the noise of open rates and click rates to show you what actually matters: dollars generated per send.
The formula is straightforward:
RPE = Total Revenue from Email Campaigns ÷ Total Emails Sent

Say you ran a promotional campaign, sent 50,000 emails, and attributed $75,000 in revenue to it. Your RPE is $1.50. Every email in that campaign earned your business $1.50 on average.
Here’s what you need to calculate it:
- Total revenue from email: All purchases or conversions directly attributed to your email campaign within a defined window (typically 3–7 days after send)
- Total emails sent: The full count of emails delivered in that campaign or time period
- A consistent attribution model: Last-click, first-click, or linear; pick one and stick with it across all campaigns so your numbers stay comparable
RPE also scales across campaigns with different list sizes, which makes it genuinely useful for comparing a 5,000-subscriber segment against a 500,000-subscriber broadcast. A campaign with a 40% open rate can easily underperform one with a 25% open rate if the latter converts better or attracts higher-value buyers. RPE captures all of that in a single number.

What counts as a good or bad revenue per email?
The average RPE in the U.S. market sits around $2.05 as of 2026, but that number is a starting point, not a target. Industry, list maturity, average order value, and email type all pull that figure in very different directions.
$2.05 is the approximate average revenue per email in the U.S. market for 2026, though high-ticket ecommerce and SaaS upgrade campaigns regularly exceed this by a wide margin.
Standard promotional campaigns in ecommerce tend to generate roughly $0.10–$0.50 per email sent, while automated behavioral triggers, like abandoned cart flows or post-purchase sequences, can reach $1.00 or more per email. A well-tuned lifecycle automation on a mature list can push well past the $2.05 average.
A few factors that shape whether your RPE is healthy or not:
- Average order value (AOV): A brand selling $300 products will naturally see higher RPE than one selling $20 items, even with identical conversion rates
- List quality: A list built through organic acquisition with strong engagement history outperforms one padded with cold leads
- Email type: Transactional and lifecycle emails (abandoned cart, win-back) consistently outperform one-off promotional blasts
- Industry: Retail, travel, and high-ticket B2B see very different baselines; comparing your RPE to a cross-industry average is rarely useful
- Send frequency: Sending too often can suppress RPE by fatiguing your list, even as total volume climbs
Don’t panic if your RPE sits below the average. A newer list, a lower-AOV product, or a heavy reliance on broadcast campaigns will all pull the number down. The more useful question is whether your RPE is trending up over time.
Best practices that actually move your revenue per email
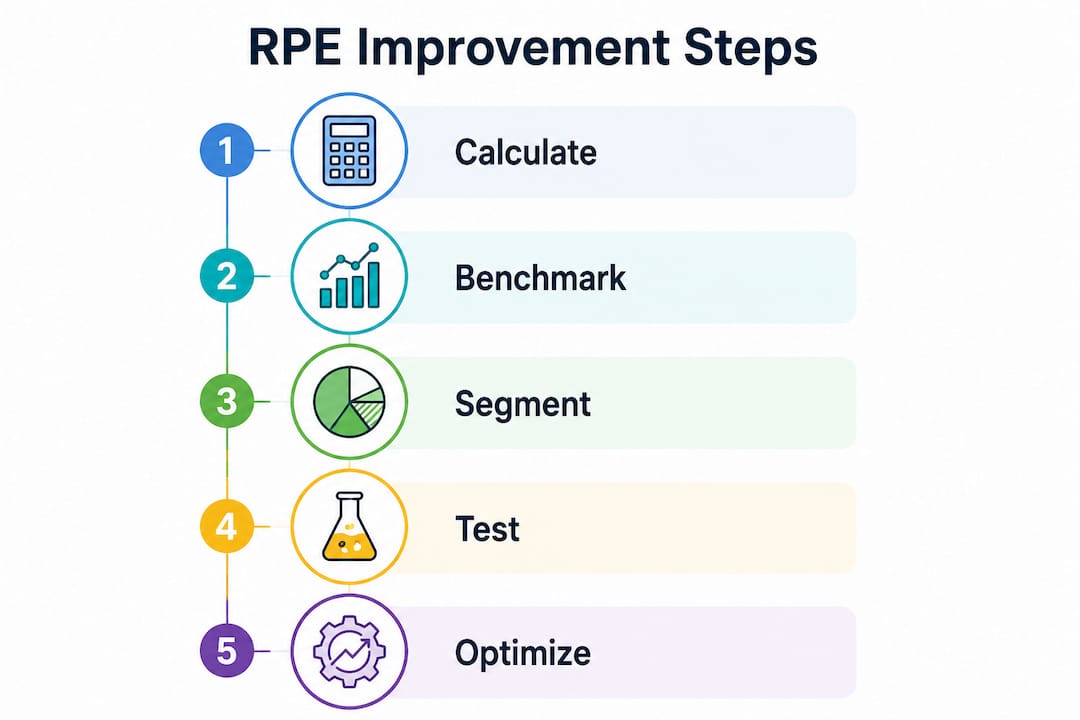
Improving RPE comes down to three levers: who you’re sending to, what you’re sending, and how you track the results. Pull all three and the gains compound.
- Tighten your targeting. Sending to your full list every time is the fastest way to suppress RPE. Narrowing sends to engaged, high-intent segments almost always lifts revenue per send, even when total send volume drops.
- Match email type to goal. Different email types drive revenue differently: a promotional blast and an abandoned cart flow should never be measured by the same RPE benchmark. Lifecycle and trigger-based emails consistently outperform broadcast campaigns on a per-send basis.
- Write offers that convert. Subject line, preview text, offer clarity, and a single strong call to action all affect whether a recipient buys. A/B testing these elements is how you find what works for your specific audience.
- Fix your attribution window. If you’re using a 30-day attribution window, you’re almost certainly overcounting revenue. A 3–7 day window is standard for ecommerce; SaaS teams often use a shorter window tied to trial or upgrade behavior.
- Audit send frequency. More emails don’t always mean more revenue per email. If RPE is declining while send volume grows, list fatigue is the likely culprit.
- Invest in automation. Welcome sequences, cart recovery flows, and post-purchase emails generate revenue around the clock without manual effort. They also tend to carry the highest RPE of any email type.
Pro Tip: Don’t chase RPE in isolation. Pairing it with Revenue per Subscriber (RPS) tells you whether you’re squeezing short-term revenue at the cost of long-term list health. If RPE is climbing but unsubscribe rates are rising too, you’re burning your list faster than you’re growing it.
Reliable tracking is the foundation of all of this. If your email platform isn’t connected to your revenue data with a consistent attribution model, your RPE numbers are guesses. Klaviyo, for example, connects directly to ecommerce platforms and applies a configurable attribution window, so the revenue figures tied to each campaign are traceable and consistent. You can read more about proven tactics for DTC brands to see how attribution setup fits into a broader email revenue strategy.
How segmentation and A/B testing raise your RPE
Segmentation is the single highest-leverage activity for improving revenue per email. When you send the right message to the right person, conversion rates climb and RPE follows.
Segmentation variables worth testing:
- Purchase history (first-time buyers vs. repeat customers)
- Engagement tier (active openers vs. lapsed subscribers)
- Product category interest
- Geographic location or time zone (for send-time optimization)
- Customer lifetime value (CLV) tier
The logic is simple: a re-engagement campaign sent to your top 20% of buyers by CLV will almost always outperform the same campaign sent to your full list. Segmenting your email list by behavior and purchase history is one of the most proven ways to lift RPE without changing a single word of your copy.
A/B testing works best when you isolate one variable at a time. Testing subject line AND offer AND send time simultaneously tells you nothing useful. Pick one, run the test on a statistically meaningful sample, and apply the winner before moving to the next variable.
| Testing variable | What it affects | Recommended sample size |
|---|---|---|
| Subject line | Open rate, which feeds RPE | — |
| Offer or CTA | Click-to-conversion rate | — |
| Send time | Engagement and purchase timing | At least 500 per variant |
| Segment definition | Who receives the email | Varies by list size |
Pro Tip: In Klaviyo, you can run A/B tests directly within flows, not just campaigns. Testing the timing or messaging of an abandoned cart email, for example, can lift RPE on one of your highest-performing automations without touching your broadcast schedule.
Segmentation and testing aren’t one-time projects. The brands that consistently see strong RPE treat them as ongoing processes, reviewing segment performance monthly and running at least one active test at any given time.
Expert insights on RPE attribution and its strategic role
RPE is only as reliable as the attribution model behind it. This is where most marketers run into trouble.
Multi-touch customer journeys are the norm, not the exception. A subscriber might open a promotional email, click a retargeting ad, and then convert through a direct visit three days later. Depending on your attribution setup, that sale could be credited to email, to paid social, or to direct traffic. Consistent attribution rules are what make RPE a valid metric rather than a number you can manipulate by adjusting the window.
RPE provides an objective measure of a campaign’s financial success, especially as privacy protections reduce the reliability of open and click metrics. Unlike open rate, RPE can’t be inflated by a privacy proxy. It either generated revenue or it didn’t.
Apple’s Mail Privacy Protection, rolled out starting in 2021, pre-loads email content for iOS and macOS Mail users, which means open rates are now partially or fully unreliable for a large share of any U.S. list. The shift toward revenue-based metrics like RPE isn’t just a preference; it’s a practical response to the fact that open rate data is no longer trustworthy at scale.
RPE also plays a different role depending on where a subscriber sits in the lifecycle:
- Acquisition stage: Open rate and list growth matter more; RPE is often low because new subscribers haven’t converted yet
- Retention stage: RPE becomes the primary indicator of whether your campaigns are driving repeat purchases
- Loyalty stage: Revenue per Subscriber (RPS) and customer lifetime value complement RPE to show long-term program health
RPE is an operational metric, focused on immediate revenue per send. It’s distinct from email marketing ROI, which factors in the full cost of running your email program. Both matter, but they answer different questions. ROI tells you whether email is worth the investment overall; RPE tells you which specific campaigns and segments are pulling their weight. Analytics-driven programs that track marketing ROI carefully tend to use both in tandem.
How RPE calculation changes by business model
Ecommerce and SaaS both use RPE, but the mechanics of calculating it differ enough that treating them the same leads to bad decisions.
Ecommerce is the most straightforward case. Revenue is transactional and immediate: a subscriber clicks, buys, and the sale is recorded. Attribution windows of 3–7 days are standard. The main complexity is multi-channel attribution, since email is rarely the only touchpoint before a purchase.
SaaS is trickier. Revenue events are upgrades, trial conversions, or expansion revenue, and they often happen days or weeks after the email that influenced them. A 7-day attribution window may miss a significant portion of email-influenced conversions. Many SaaS teams use a longer window (14–30 days) or track email’s role in pipeline creation rather than closed revenue directly.
B2B with long sales cycles presents the hardest attribution challenge. An email might influence a deal that closes six months later. In these cases, RPE as a direct metric is less useful; pipeline influence or meeting-booked rate often serves as a better proxy.
Newsletter and content businesses calculate RPE differently again. Revenue can come from sponsorships, affiliate commissions, or paid subscriptions, none of which tie to a single purchase event. RPE here is often calculated on a per-issue or per-send basis, dividing total issue revenue (sponsorship fees plus affiliate income) by the number of subscribers who received it.
The common thread across all models: define what counts as revenue, set a consistent attribution window, and apply both rules uniformly across every campaign you measure.
How to benchmark your RPE against industry standards
Benchmarking RPE is genuinely difficult because most platforms don’t publish per-industry RPE data the way they do for open rates or click rates. The $2.05 U.S. average cited earlier is a useful reference point, but your real benchmark should be your own historical performance.
Start by calculating RPE for every campaign type you run, broken out by segment, email type, and send frequency. Once you have three to six months of data, you’ll see your own baseline clearly. A weekly newsletter that consistently generates $0.30 RPE isn’t underperforming if that’s been your steady rate for a year; it’s underperforming if it drops to $0.12 without a clear explanation.
For external benchmarks, the most reliable approach is to compare within your own category:
- Ecommerce promotional campaigns: $0.10–$0.50 per email is a common range for broadcast sends
- Automated behavioral triggers (cart abandonment, win-back): $1.00 or more per email is achievable on a well-built flow
- High-ticket or B2B campaigns: RPE can run much higher, but send volumes are typically smaller
Tracking RPE trends over time matters more than any single number. A declining RPE, even as total email revenue grows, can signal list fatigue or audience saturation that’s being masked by list growth. A rising RPE means your program is getting more efficient at converting each send into revenue. For ecommerce brands specifically, email’s role in customer retention is a major driver of long-term RPE improvement, since repeat buyers convert at higher rates than first-time purchasers.
Key Takeaways
Revenue per email is the most direct financial measure of email campaign performance, calculated by dividing total attributed revenue by total emails sent, and improving it requires consistent attribution, smart segmentation, and ongoing testing.
| Point | Details |
|---|---|
| RPE formula | Divide total email-attributed revenue by total emails sent; use a consistent 3–7 day attribution window. |
| U.S. benchmark | The average RPE in the U.S. is approximately $2.05, but automated triggers regularly exceed this figure. |
| Segmentation lifts RPE | Sending to high-intent, behavior-based segments raises conversion rates and revenue per send. |
| Pair RPE with RPS | Revenue per Subscriber balances short-term RPE gains against long-term list health and engagement. |
| Attribution consistency | A fixed attribution model (last-click or linear) is required for RPE numbers to be comparable across campaigns. |