
Email Open Rate Explained: 2026 Marketer’s Guide
TL;DR:
- Email open rates are increasingly distorted by privacy features, making raw metrics unreliable indicators of engagement.
- Marketers should focus on click-through, reply, and conversion rates, which reflect genuine audience actions.
Email open rate is defined as the percentage of unique email opens divided by the total number of emails delivered, calculated as (Unique Opens / Emails Delivered) x 100. That formula sounds simple, but in 2026 it tells only part of the story. Apple Mail Privacy Protection (MPP), Gmail proxy servers, and corporate security filters have fundamentally distorted what that number actually means. This guide breaks down how the metric works, where it misleads, what benchmarks to trust, and how to improve genuine engagement when your open rate data is increasingly noisy.
How is email open rate calculated and what affects its accuracy?
The standard open rate formula starts by excluding hard bounces and invalid addresses from your total sends. What remains is your “emails delivered” figure. Divide unique opens by that number, multiply by 100, and you have your open rate. The word “unique” matters here. If one subscriber opens the same email five times, it counts as one open, not five.
The mechanism behind every open event is a tracking pixel. When you send an email, your platform embeds a tiny, invisible image in the HTML. When a recipient’s email client loads that image, it fires a request back to your server and registers an open. No image load means no open recorded.
That pixel system has two failure modes that distort your data in opposite directions:
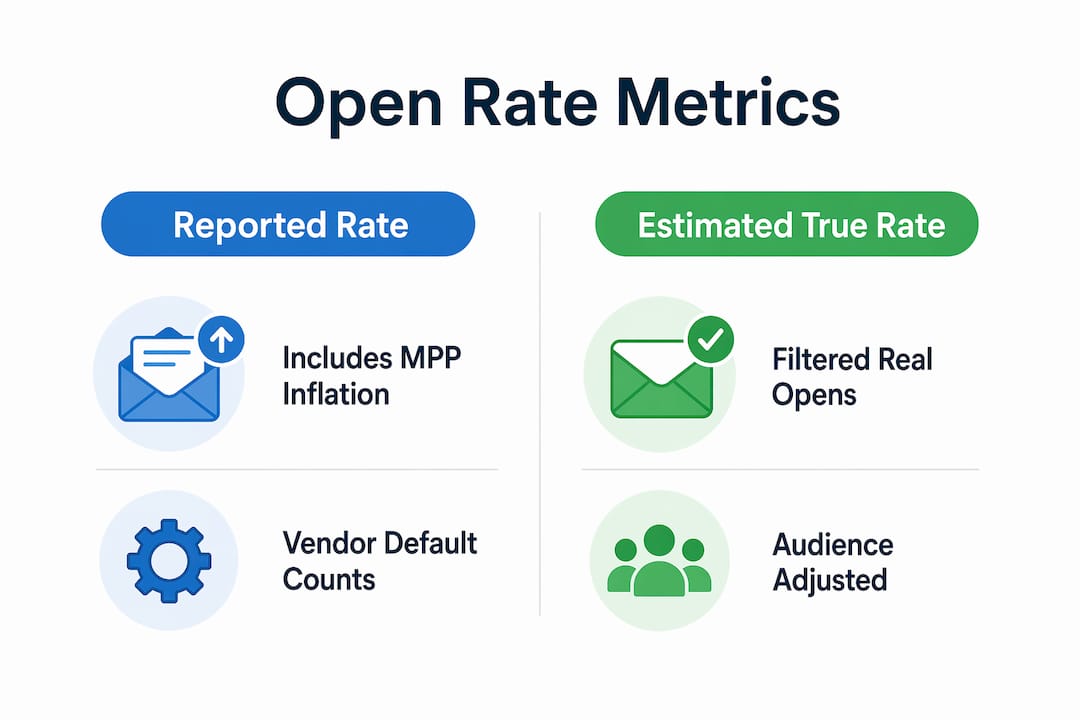
- Inflation from privacy features. Apple MPP and corporate security filters inflate raw open rates by 20–35 percentage points. A reported 70% open rate often represents only 25–35% actual human reads. Apple’s system preloads images before the user ever sees the email, triggering the pixel automatically.
- Deflation from image blocking. Blocking images or disabling auto image load causes true opens to go uncounted. A subscriber who reads every word of your email but has images turned off registers as a non-opener.
Pro Tip: Some platforms now offer confidence-scored open rate metrics. These filter out low-confidence pixel loads from proxies and prefetching, giving you a more reliable signal than raw open rate alone. Look for this feature in Klaviyo, Mailchimp, or your current sending platform.
The result is a metric that can simultaneously overcount and undercount real opens depending on your audience’s email client mix. Treat raw open rate as a directional indicator, not a precise measurement.
Are email open rates still a reliable measure of campaign success?
Open rates do not confirm that a subscriber read your message, clicked anything, or formed any opinion about your brand. The pixel fires the moment images load, which can happen before a human eye ever scans the subject line. That is the core limitation of the metric.
The industry has recognized this shift. Marketing focus in 2026 is moving toward engagement metrics like reply rates and click-through rates. The average reply rate sits at 3.43%, and top campaigns exceed 10%. Those numbers reflect actual human behavior, not automated image prefetching.
Here are the metrics that give you a more complete picture of email marketing performance:
- Click-through rate (CTR). The percentage of delivered emails that generated at least one click. CTR measures whether your content motivated action, not just whether an image loaded.
- Click-to-open rate (CTOR). Clicks divided by opens. This isolates the quality of your email body and call-to-action independent of subject line performance.
- Reply rate. Particularly valuable in B2B and cold outbound. A reply requires deliberate human action and is nearly impossible to fake with automation.
- Conversion rate. The percentage of recipients who completed a desired action, such as a purchase or sign-up. This is the metric that connects directly to revenue.
- Unsubscribe and spam complaint rates. Rising numbers here signal list fatigue or targeting problems before your deliverability suffers.
Open rate still serves a purpose. A sudden drop or spike on a stable list can indicate deliverability issues, subject line changes, or pixel prefetch distortions. Use it as a diagnostic signal, not a success metric. When your open rate moves significantly in either direction, investigate the cause rather than celebrating or panicking.
What are typical email open rate benchmarks by industry?
Benchmarks give you a reference point, but they require careful interpretation in 2026 because most published figures include MPP-inflated data. Read every benchmark with that caveat in mind.
Typical open rate benchmarks across major categories look like this:
| Industry / Campaign Type | Reported Open Rate | Estimated True Human Open Rate |
|---|---|---|
| Retail / Ecommerce | 18–25% | 10–15% |
| SaaS / B2B | 22–28% | 14–18% |
| Well-targeted cold outbound | 35–50% | 20–35% |
| Transactional emails | 45–65% | 35–50% |
| Lifecycle / Automated flows | 30–45% | 20–30% |
Transactional emails, such as order confirmations and shipping notifications, consistently outperform marketing campaigns. Recipients expect and want those messages. Lifecycle and automated flows, like welcome sequences and abandoned cart emails, perform better than broadcast campaigns because they reach subscribers at a relevant moment.
The inflation effect from Apple MPP alone can add 10–35 percentage points to reported figures. That means a retail brand reporting a 22% open rate may be seeing closer to 12–14% genuine human opens. Neither number is wrong. They measure different things. The reported figure reflects pixel loads. The estimated figure reflects actual attention.
Use benchmarks as loose guides. Your own historical trends are more valuable than any industry average because they reflect your specific list, audience, and sending practices.
How can you improve real email open rates in 2026?
Improving authentic opens requires focusing on factors that influence human behavior, not pixel mechanics. The good news is that the tactics that drive real opens also tend to improve every other engagement metric simultaneously.
Sender name recognition comes first. Personal sender names outperform company names by 15–25% in B2B contexts. “Sarah from Take-action” consistently beats “Take-action Marketing” in open rate tests. Recipients decide whether to open based on who sent it before they read the subject line.
- Write subject lines that earn the open. Keep them under 50 characters so they display fully on mobile. Use the subscriber’s first name when your data quality supports it. Ask a question or create a specific curiosity gap. Avoid spam trigger words like “free,” “guaranteed,” or excessive punctuation.
- Send at the right time. Tuesday through Thursday mornings between 9 a.m. and 11 a.m. in the recipient’s local time zone consistently produce above-average open rates across most industries. Test your specific audience, but start there.
- Segment your list aggressively. A tightly targeted segment of 2,000 engaged subscribers will outperform a broadcast to 20,000 cold contacts on every metric. Klaviyo’s segmentation tools let you filter by purchase history, engagement recency, and browse behavior to build precise audiences.
- Practice list hygiene monthly. Remove or suppress subscribers who have not engaged in 90–180 days. Sending to unengaged contacts damages your sender reputation and reduces deliverability for your entire list.
- Monitor deliverability, not just opens. Use tools like Google Postmaster Tools or MXToolbox to check your domain reputation. Poor deliverability means your emails land in spam before any open is possible.
Pro Tip: Build a re-engagement flow for subscribers who have gone quiet. Send a two-email sequence asking if they still want to hear from you. Those who click to confirm are your most valuable re-engaged contacts. Those who do not respond should be suppressed. This single practice can lift your overall open rate by removing the dead weight dragging your averages down. Pair this with ecommerce email marketing tips to keep your active list converting.
Key takeaways

Email open rate is a directional metric that requires context, complementary data, and an understanding of privacy-driven inflation to be genuinely useful in 2026.
| Point | Details |
|---|---|
| Standard formula | Calculate as (Unique Opens / Emails Delivered) x 100, excluding hard bounces. |
| Privacy inflation is real | Apple MPP inflates reported open rates by 20–35 points; treat raw figures as overestimates. |
| Open rate alone is insufficient | Pair it with CTR, CTOR, reply rate, and conversions for a complete performance picture. |
| Benchmarks need adjustment | Subtract 10–20 points from published benchmarks to estimate true human open rates. |
| Sender name drives opens | Personal sender names outperform brand names by 15–25% in B2B; test yours. |
What open rate data actually tells you (and what it doesn’t)
From my experience working with ecommerce brands on Klaviyo, the biggest mistake I see is treating open rate as a report card. A brand hits 40% open rate and feels like it is winning. Another sees 18% and panics. Neither reaction is warranted without context.
Open rate is a diagnostic tool. It tells you whether your subject line and sender name are doing their job of getting the email opened. That is all. The moment you start optimizing your entire email program around open rate, you start making bad decisions. You write clickbait subject lines that get opens but kill click rates. You suppress your best customers because they happen to use Apple Mail and show as “already opened” before they even wake up.
The brands I have seen grow fastest through email treat open rate as one signal in a dashboard of five or six. They watch CTOR to evaluate body content. They watch reply rate to gauge genuine interest. They watch revenue per email to connect the channel directly to business outcomes. Open rate sits in the corner as a useful early warning system, nothing more.
The privacy landscape will keep shifting. Apple MPP was the first major disruption. More will follow. The marketers who build their strategy around metrics that require real human action, clicks, replies, purchases, will be far more resilient than those chasing an open rate number that a server farm in California may have generated on their behalf.
— Take
Ready to move beyond open rate metrics?
Understanding email open rate explained is the starting point. Building a program that actually drives revenue requires the right strategy, segmentation, and automation working together.

Take-action specializes in building Klaviyo-powered email programs for ecommerce brands that measure what actually matters. From welcome flows and abandoned cart sequences to full campaign strategy and list management, the team focuses on clicks, conversions, and revenue, not vanity metrics. If your email channel is not pulling its weight as a growth driver, explore Take-action’s services to see how a data-driven approach changes the results. You can also learn how to repurpose content for ecommerce email to get more mileage from every campaign you send.
FAQ
What is the standard email open rate formula?
The industry-standard formula is (Unique Opens / Emails Delivered) x 100. Emails delivered excludes hard bounces and invalid addresses from the total sent.
How much does apple MPP inflate open rates?
Apple Mail Privacy Protection inflates reported open rates by 20–35 percentage points. A reported 70% open rate often reflects only 25–35% actual human reads.
What is a good email open rate in 2026?
Retail and ecommerce brands typically see 18–25% reported open rates, while SaaS and B2B averages run 22–28%. Subtract 10–20 points from any benchmark to estimate true human engagement after accounting for privacy inflation.
Which metrics should replace open rate as primary kpis?
Click-through rate, click-to-open rate, reply rate, and conversion rate all reflect deliberate human behavior. The average reply rate across campaigns is 3.43%, with top performers exceeding 10%.
Why did my open rate suddenly drop or spike?
A sudden change on a stable list signals a deliverability issue, a shift in subject line quality, or a change in pixel prefetch behavior from a major email client. Investigate deliverability first using Google Postmaster Tools, then review recent subject line changes before drawing conclusions.