
How to measure social media impact for e-commerce
TL;DR:
- Many e-commerce teams undervalue social media’s long-term impact by focusing on vanity metrics.
- Effective measurement involves tracking engagement, assisted conversions, LTV, and revenue across the full funnel.
- Using multi-touch attribution and cohort analysis reveals social media’s true contribution to revenue and retention.
Most e-commerce marketing managers believe they’re measuring social media effectively because their dashboards are full of numbers. But a platform engagement rate gap this stark should stop you cold: TikTok averages 3.70% engagement, while Instagram sits at 0.48%, Facebook at 0.15%, and X at just 0.12%. If your team treats these platforms the same way, you’re already making decisions on flawed assumptions. This article walks you through what actually matters, which models to trust, and how to build a measurement system that connects social activity to real business outcomes like retention, lifetime value, and revenue growth.
Table of Contents
- Why measuring social media impact is crucial for e-commerce
- Key KPIs and benchmarks that matter in 2026
- Models and frameworks: Attribution and the real role of social media
- Actionable tactics to improve and verify social impact
- What most e-commerce teams miss about social media measurement
- Supercharge your retention with actionable measurement
- Frequently asked questions
Key Takeaways
| Point | Details |
|---|---|
| Move beyond vanity metrics | Likes and follower counts do not truly reflect social’s role in driving retention and revenue. |
| Use advanced attribution | Adopt multi-touch models to accurately credit social media for assisting and closing e-commerce sales. |
| Benchmark with 2026 standards | Compare your results to up-to-date engagement and ROAS benchmarks to set meaningful goals. |
| Integrate retention metrics | Track customer lifetime value, repeat purchases, and community impact for the full picture. |
| Test and optimize with expert tactics | Leverage UGC, micro-influencers, and platform-specific strategies for measurable improvements. |
Why measuring social media impact is crucial for e-commerce
The temptation to judge social performance by likes and follower counts is understandable. These numbers are visible, fast-moving, and feel like progress. But vanity metrics alone are insufficient when what you actually need to know is whether social media is driving revenue, retaining customers, and building long-term value. Organic social excels at retention and community building, while paid social drives more direct sales. Treating both the same way leads to misallocated budget and missed opportunities.
The attribution problem runs deeper than most teams realize. Last-click attribution, still the default in many analytics setups, gives all conversion credit to the final touchpoint before purchase. Social media, which typically operates at the awareness and consideration stages, gets almost no credit. Yet social introduces 48% of customers to a brand before any other channel does, even though only 2 to 5% convert on their first social click. The lifetime value of customers acquired through social is often 2 to 3x higher than other acquisition channels, which makes the undervaluation even more costly.
Here’s what a more complete measurement approach actually tracks:
- Engagement rate by platform (not just total likes)
- Assisted conversions from social in multi-touch reports
- Customer lifetime value segmented by acquisition source
- Retention rates for social-acquired cohorts versus paid search cohorts
- Revenue attributed to social across the full funnel, not just last-click
One of the most common metric pitfalls e-commerce teams fall into is optimizing for metrics that feel good but don’t correlate with business growth. A post going viral is exciting. But if none of those viewers convert, subscribe, or return, the viral moment has zero business value.
“The brands winning on social aren’t the ones with the most followers. They’re the ones who know exactly what social contributes to the customer journey and optimize accordingly.”
Integrating social data with your email platform, for example, creates a feedback loop that’s genuinely powerful. When you understand which social content drives email sign-ups that later convert, you can replicate that content type intentionally. Exploring how UGC benefits ecommerce email programs is one concrete example of this cross-channel thinking in action.
Key KPIs and benchmarks that matter in 2026
Not every metric deserves equal attention. The KPIs that matter most are the ones tied directly to business outcomes. Here’s a quick breakdown of the core metrics and what they actually measure:
- Engagement rate: The percentage of your audience that actively interacts with content. High engagement signals relevance and trust.
- ROAS (Return on Ad Spend): Revenue generated per dollar spent on social ads. This is your clearest paid efficiency signal.
- Conversion rate from social: The percentage of social visitors who complete a purchase. Tells you if your social traffic is qualified.
- CAC (Customer Acquisition Cost): How much you spend to acquire one customer through social. Compare this across channels.
- LTV (Lifetime Value): The total revenue a customer generates over their relationship with your brand. Social-acquired customers often outperform here.
- Assisted revenue: Revenue from orders where social was a touchpoint, even if it wasn’t the last click.
- CTR (Click-Through Rate): The percentage of people who click your link after seeing your content or ad.
Here are the 2026 platform benchmarks to use as realistic performance targets:
| Platform | Avg. engagement rate | ROAS (paid) | Conversion rate |
|---|---|---|---|
| TikTok | 3.70% | 3x to 5x | 2% to 5% |
| 0.48% | 3x to 5x | 2% to 5% | |
| 0.15% | 3x to 5x | 2% to 5% | |
| X (Twitter) | 0.12% | Varies | 1% to 3% |
These numbers matter because they give you a realistic baseline. If your Instagram engagement rate is 0.80%, that’s strong. If your TikTok rate is 1.5%, you have room to grow. Use benchmarks to set goals, not to feel good about numbers that look big in isolation.

Pro Tip: Match your KPI selection to your business objective. If you’re focused on retention, prioritize LTV and repeat purchase rate by social cohort. If you’re scaling acquisition, ROAS and CAC are your north stars.
For brands leaning into creator-driven content, UGC and influencer strategies tend to produce higher engagement rates and stronger LTV outcomes than polished brand content alone. Similarly, micro-influencer campaigns often outperform mega-influencer deals on a cost-per-conversion basis, which shows up clearly when you’re tracking the core ecommerce metrics that actually drive growth.
Models and frameworks: Attribution and the real role of social media
Attribution is where most measurement strategies break down. The model you choose determines what you believe social is worth, and that belief drives your budget decisions. Getting this wrong is expensive.
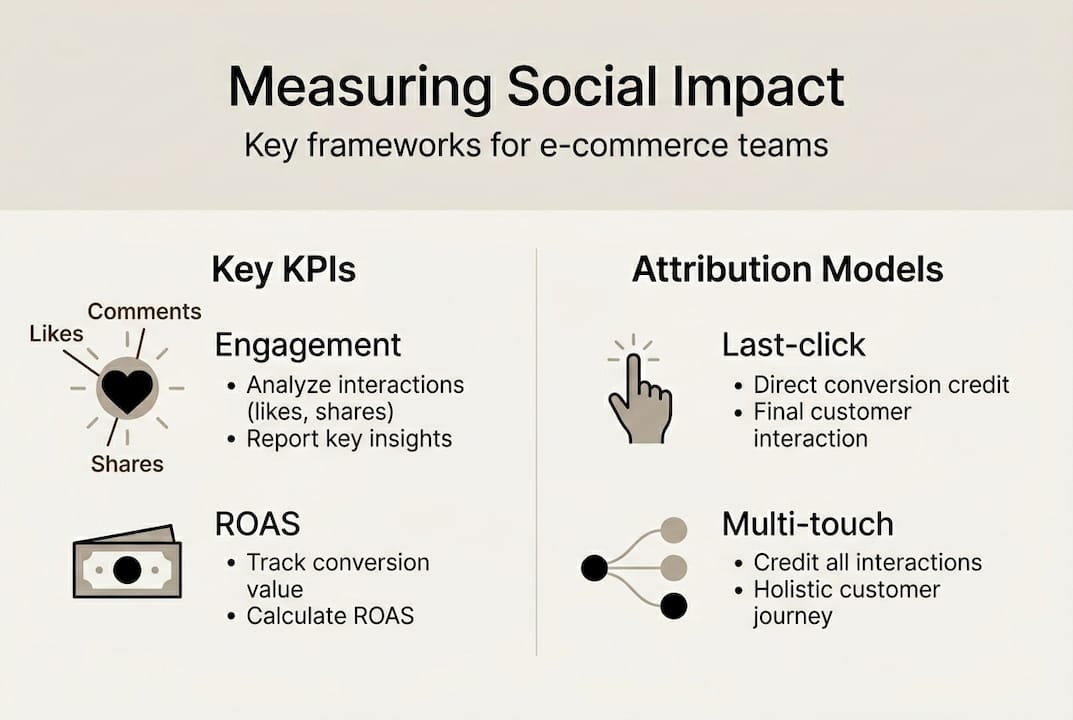
Last-click attribution is the most common model and the most misleading for social. It rewards only the final touchpoint, which is almost never a social post for considered purchases. Here’s how the leading multi-touch attribution models compare:
| Model | How it works | Best for |
|---|---|---|
| Last-click | 100% credit to final touchpoint | Simple direct-response campaigns |
| Linear | Equal credit to all touchpoints | Understanding full journey |
| Time-decay | More credit to recent touchpoints | Short sales cycles |
| U-shaped (position-based) | 40% to first and last, 20% to middle | Awareness plus conversion focus |
| Data-driven (ML) | Credit based on actual conversion patterns | High-volume, mature accounts |
Here’s a step-by-step process for selecting the right model:
- Audit your sales cycle length. Short cycles (under 3 days) can use time-decay. Longer cycles need U-shaped or data-driven.
- Identify your business goal. Awareness campaigns benefit from U-shaped. Retention campaigns need linear or cohort-based analysis.
- Set up GA4 with a 30-day attribution window for social, since most social-influenced purchases happen within that window.
- Run cohort analysis to compare the LTV of customers from different acquisition sources over 90 and 180 days.
- Layer in marketing mix modeling if you have enough data volume. This statistical approach separates the effect of each channel without relying on cookie-based tracking.
Pro Tip: In GA4, switch from last-click to data-driven attribution in your conversion settings. You’ll likely see social’s contribution to revenue increase by 20 to 40% immediately, which reflects reality more accurately.
For e-commerce brands running influencer programs, advanced attribution methods and influencer marketing attribution frameworks can help you isolate the true value of creator-driven content beyond simple last-click reporting. The ecommerce data analytics layer underneath all of this is what separates brands that scale from brands that stall.
Actionable tactics to improve and verify social impact
Measurement frameworks only matter if they lead to action. Here are the tactics that consistently move the needle on social ROI and retention, along with ways to verify they’re working.
Content and channel tactics that drive measurable results:
- UGC outperforms brand content by 22% on average. Prioritize customer photos, reviews, and real-use videos over polished studio shoots.
- Micro-influencers build trust more effectively than macro accounts for niche e-commerce categories. Their audiences are smaller but more engaged and more likely to convert.
- Platform-native features (TikTok Shops, Instagram Checkout, Facebook Shops) reduce friction and keep the conversion path short.
- Diversifying beyond Meta reduces risk and often reveals cheaper, higher-converting audiences on platforms like TikTok or Pinterest.
The numbers behind TikTok’s e-commerce potential are striking. One documented case showed TikTok followers grew 1,812%, sales increased by 7,317%, and engagement rate improved by 292% over a focused campaign period. PURELEI’s TikTok Smart+ campaign produced a 100% ROAS increase. These aren’t outliers. They’re what happens when content strategy aligns with platform behavior and measurement is in place to reinforce what works.
How to validate your social impact:
- Run brand lift surveys after major campaigns to measure awareness and purchase intent shifts.
- Use incrementality testing (holdout groups) to isolate the actual sales lift from social versus what would have happened anyway.
- Track LTV by acquisition source in your email platform or CRM over 90, 180, and 365-day windows.
- Integrate Klaviyo tracking with social data to connect social sign-ups to downstream email revenue.
“Validation is not a one-time audit. It’s a continuous loop of testing, measuring, and adjusting that compounds over time.”
For brands investing in creator content, UGC digital strategies that feed into email flows create a measurable retention loop. Social brings the customer in. Email keeps them coming back. Measuring both together gives you a complete picture. Applying user engagement tactics across both channels amplifies the effect.
What most e-commerce teams miss about social media measurement
Here’s the uncomfortable truth: most e-commerce teams are measuring social media in a way that systematically undervalues it, and then making budget cuts based on that flawed data.
The fixation on short-term direct conversions ignores the cumulative effect social has on customer loyalty and community. A customer who follows your brand on TikTok for three months before buying has a fundamentally different relationship with your brand than someone who clicked a Google ad. That relationship shows up in repeat purchase rates, referral behavior, and LTV. But if you’re only looking at last-click data, you’ll never see it.
Cohort analysis changes this. It can reveal 40 to 70% more attribution and retention value than last-click models suggest. That’s not a rounding error. That’s the difference between cutting your social budget and doubling it.
The brands that get this right blend attribution models with a genuine commitment to authentic content for retention. They understand that social’s job isn’t always to close the sale. Sometimes its job is to make the customer feel like they belong to something. And that feeling is what drives the second, third, and fourth purchase. Measure for that, and your entire social strategy gets sharper.
Supercharge your retention with actionable measurement
Putting these frameworks into practice takes more than a dashboard refresh. It takes a clear strategy, the right tools, and a team that knows how to connect social signals to retention outcomes.
At Take Action, we help e-commerce brands build the measurement infrastructure and retention systems that turn social media from a cost center into a compounding revenue driver. From attribution setup to Klaviyo automation that captures and converts social audiences, our approach is built around what actually moves LTV. If you’re ready to see what your social channels are really contributing, our retention strategy experts can map out a plan tailored to your store’s goals and growth stage.
Frequently asked questions
Which social media metrics should I prioritize for measuring real impact in e-commerce?
Prioritize engagement rate, ROAS, conversion rate, and LTV over vanity metrics like followers or likes. These KPIs connect directly to revenue and retention outcomes.
How does multi-touch attribution improve social media measurement over last-click?
Multi-touch attribution credits social media for assisting conversions across the full customer journey, which better reflects its role in awareness and long-term retention rather than just final-click sales.
What is a good ROAS benchmark for social media ads in 2026?
A solid ROAS benchmark for social ads in 2026 is between 3x and 5x, compared to 4x to 6x for paid search and 6x to 10x for email marketing.
How can I track the long-term value of social media-acquired customers?
Segment customers by acquisition source and compare retention and repeat purchase rates over 90, 180, and 365-day windows. Social-acquired customers often show 2 to 3x higher LTV than other channels when tracked this way.
Recommended
- Klaviyo Integration: 30x Revenue Boost from Social Media | Take Action Blog | Take Action
- Blog - Email Marketing Insights | Take Action | Take Action
- Social Proof Influencer Marketing for Ecommerce Success | Take Action Blog | Take Action
- Digital Media Buying Agency Impact on Ecommerce | Take Action Blog | Take Action
- The Most Important eCommerce Data Analytics Affecting Your ROI