
Average Email Open Rate: 2026 Benchmarks and Insights
TL;DR:
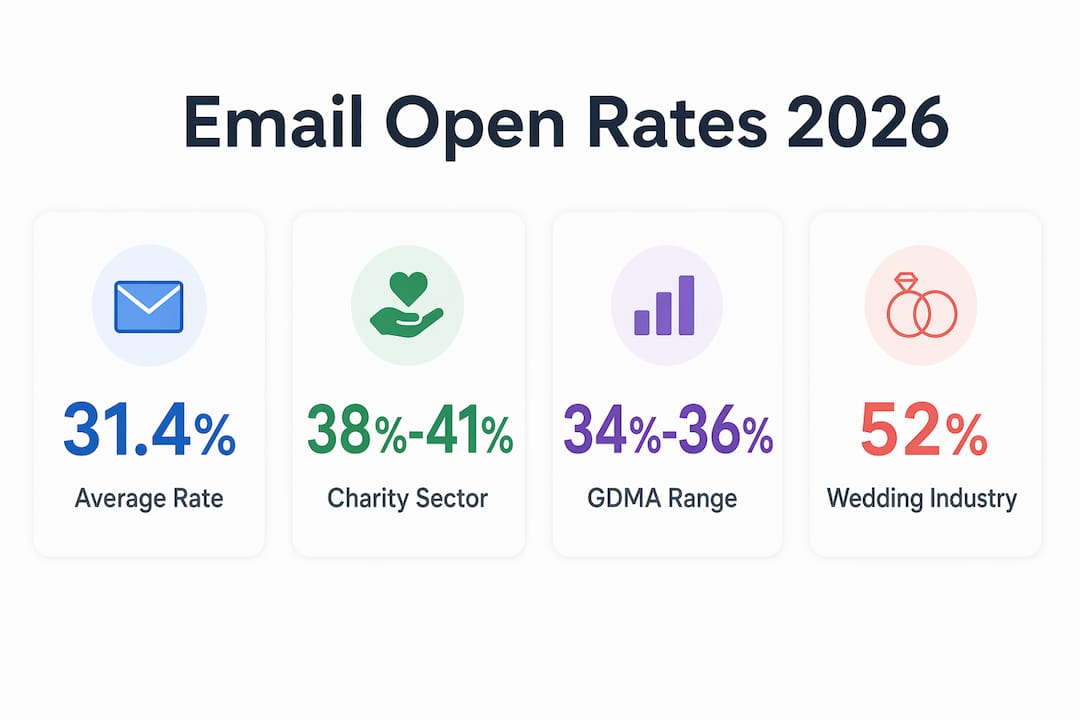
- The average email open rate across industries is 31.4% in 2026, but benchmarks vary by sector.
- Marketers should focus on list quality and engagement metrics like CTR and CTOR for accurate assessment.
The average email open rate is defined as the percentage of delivered emails that recipients open, making it the primary indicator of initial campaign engagement. As of 2026, the weighted average across 38 industries sits at 31.4%, based on 32 million email sends from january 2024 through march 2026. That number gives you a concrete baseline, but it hides significant variation by industry, list quality, and measurement method. Platforms like Mailchimp, Omnisend, and Klaviyo each report slightly different averages because their user bases and send volumes differ. Understanding what drives those differences is what separates marketers who act on data from those who chase vanity metrics.
What is the average email open rate across industries?
The email marketing open rate benchmark sits between 28% and 35% for most industries, with rates above 35% signaling strong engagement and a healthy sender reputation. That range comes from combined 2026 industry benchmarks and represents the realistic target for well-managed lists. Falling below 28% consistently is a signal worth investigating, not ignoring.

Industry context matters enormously. Charity, government, education, and professional services consistently outperform retail and B2B SaaS. A nonprofit sending mission-driven updates to a self-selected donor list will naturally see higher opens than a SaaS company blasting a cold prospect list. The audience’s relationship to the sender is the single biggest structural driver of open rate variation.
| Industry | Typical open rate range |
|---|---|
| Charity and nonprofit | 38%–41% |
| Government and public sector | 36%–40% |
| Education | 35%–39% |
| Professional services | 33%–37% |
| Healthcare | 31%–35% |
| Retail and ecommerce | 28%–32% |
| B2B SaaS | 24%–28% |
The GDMA International Email Benchmark 2026 reports unique open rates between 34.2% and 36.5% depending on the data source and methodology used. That spread exists because different platforms measure unique opens differently, and some include machine-triggered opens in their totals. When you pull your own numbers, confirm whether your platform filters bot activity before comparing against published benchmarks.
Pro Tip: Always compare your open rates against your specific industry benchmark, not the global average. A 29% open rate in B2B SaaS is strong. The same rate in a nonprofit context signals a problem.
What factors influence email open rates?
List quality is the single most controllable factor in your open rate. Sending to disengaged, outdated, or unverified contacts drags your average down and damages your sender reputation with inbox providers like Gmail and Outlook. List hygiene and segmentation produce significantly better open rates than broadcast strategies sent to undifferentiated lists.
Several factors work together to determine whether a subscriber opens your email:
- Sender name and reputation: Subscribers open emails from senders they recognize and trust. A branded sender name consistently outperforms a generic company address.
- Subject line quality: Short, clear subject lines perform best. Subject lines of 6–10 words tend to achieve the highest open rates because they display fully on mobile screens without truncation.
- Send timing: Sending when your audience is most active improves open probability. This varies by industry and audience segment.
- Deliverability: Emails that land in the spam folder cannot be opened. Sender reputation, authentication records (SPF, DKIM, DMARC), and list hygiene all affect deliverability directly.
- Segmentation: Targeted messages sent to relevant audience segments consistently outperform generic blasts.
The measurement picture is more complicated than it looks. Apple Mail Privacy Protection inflates raw open rate metrics by approximately 15–25 percentage points. It does this by preloading email tracking pixels before the recipient actually opens the message. That means a reported 45% open rate could reflect a true engagement rate closer to 25%. Marketers who rely on raw open data without filtering for machine opens are making decisions based on distorted numbers.
The practical response is to treat open rate as a directional signal rather than a precise measurement. Use click-through rate (CTR) and click-to-open rate (CTOR) as your primary engagement metrics when Apple MPP is a factor in your audience. Those metrics require actual human interaction and are far harder to inflate artificially.
How do open rates compare to other email performance metrics?
Open rates measure intent to engage, not actual engagement. Open rates are a starting engagement metric that must be combined with CTR, CTOR, and conversion data to give you a complete performance picture. A high open rate with a low CTR tells you the subject line worked but the email body failed. A low open rate with a high CTOR tells you the audience who did open was highly qualified.
The wedding industry makes this contrast concrete. Wedding-related email campaigns report open rates as high as 52.43%. Yet conversion rates in that sector drop to just 0.04%. Subscribers open out of curiosity or inspiration but rarely convert in a single email session. Chasing a high open rate in that context would be a misallocation of effort.
| Metric | What it measures | Limitation |
|---|---|---|
| Open rate | Initial email engagement | Inflated by Apple MPP and bots |
| Click-through rate (CTR) | Clicks as a share of delivered emails | Doesn’t show who opened |
| Click-to-open rate (CTOR) | Clicks as a share of openers | Best measure of content relevance |
| Conversion rate | Revenue or goal completions | Requires attribution tracking |
The right approach is to build a metrics stack, not rely on a single number. Open rate tells you whether your list and subject line are working. CTR tells you whether your content is compelling. Conversion rate tells you whether your offer is landing. Each metric answers a different question, and none of them is sufficient on its own.
What strategies actually improve average open rates?
Improving your email marketing open rate starts with the list, not the subject line. Most marketers reach for subject line tricks first because they are visible and easy to test. But a poorly segmented list of disengaged contacts will underperform regardless of how clever the subject line is.
These strategies produce consistent, measurable improvements:
-
Segment your list by behavior and purchase history. Sending relevant messages to the right audience is the most reliable way to lift opens. Klaviyo’s segmentation tools let you target by purchase frequency, product category, and engagement recency. Detailed guidance on ecommerce list segmentation shows how this works in practice for retail brands.
-
Remove inactive subscribers on a regular schedule. Contacts who have not opened or clicked in 90–180 days hurt your deliverability and drag down your average open rate. Run a re-engagement campaign first, then suppress or remove those who still don’t respond.
-
Write subject lines of 6–10 words. Shorter subject lines display fully on mobile and communicate the email’s value immediately. Avoid clickbait phrasing that trains subscribers to distrust your sends.
-
Spread your sends throughout the year. Concentrating campaigns during holiday periods increases inbox competition and reduces open rates. Brands that distribute sends more evenly across the calendar see better deliverability and more consistent engagement.
-
Personalize beyond first name. Dynamic content blocks that reflect a subscriber’s purchase history or browsing behavior create relevance that generic personalization cannot match.
Pro Tip: Before running subject line A/B tests, audit your list segmentation first. Testing subject lines on a poorly segmented list produces misleading results because the audience itself is the variable, not the subject line.
Proven strategies for improving open rates go deeper on each of these tactics with campaign-level examples. Effective open rate improvement comes from disciplined list management and relevant messaging, not gimmicks or tricks.
Key Takeaways
The average email open rate of 31.4% across industries is a useful benchmark, but your industry segment, list quality, and measurement method determine whether that number is meaningful for your program.
| Point | Details |
|---|---|
| Industry benchmark range | Strong open rates fall between 28% and 35%; above 35% signals excellent engagement. |
| Apple MPP distortion | Raw open rates may be inflated by 15–25 points; use CTR and CTOR as primary engagement signals. |
| List quality drives opens | Segmented, well-maintained lists consistently outperform broad broadcast strategies. |
| Open rate alone is insufficient | Combine open rate with CTR, CTOR, and conversion rate for a complete performance view. |
| Send timing and distribution | Spreading campaigns evenly throughout the year improves deliverability and open consistency. |
Open rates are a compass, not a destination
Most marketers I work with treat open rate as the headline number for campaign performance. I understand why. It’s the first metric that populates after a send, and a high number feels like validation. But after analyzing hundreds of campaigns across ecommerce and retail brands, I’ve found that open rate obsession is one of the most common ways marketers mislead themselves.
The brands with the strongest email revenue are rarely the ones with the highest open rates. They are the ones who understand what their open rate is actually measuring. They know whether Apple MPP is inflating their numbers. They know which segments are genuinely engaged versus which ones are just technically “opening” because a pixel fired. They build their decisions on CTR and CTOR, and they treat open rate as a directional check rather than a performance verdict.
The shift I’d encourage you to make is this: stop asking “is my open rate good?” and start asking “does my open rate reflect real engagement?” That question leads you to better segmentation, cleaner lists, and more honest reporting. Those are the things that actually move revenue.
The 2026 marketer’s guide to open rates covers this measurement framework in more detail if you want to go deeper on filtering and attribution.
— Take
How Take-action helps brands improve email performance
Take-action is a specialized email marketing and retention agency that helps ecommerce brands turn email into a primary revenue channel. The team builds Klaviyo-powered programs that combine disciplined list segmentation, automated flows, and campaign strategy to lift open rates, click rates, and revenue. Every engagement starts with a data audit to identify where your current program is losing engagement and where the clearest opportunities sit. If your open rates are flat, your list is growing stale, or your flows were set up once and never revisited, Take-action builds the infrastructure to fix that. Work with Take-action to build an email program that performs beyond the open.
FAQ
What is a good email open rate in 2026?
A good email open rate falls between 28% and 35% for most industries. Rates above 35% indicate strong engagement and a healthy sender reputation, according to Omnisend’s 2026 benchmarks.
How does Apple Mail Privacy Protection affect open rate data?
Apple Mail Privacy Protection preloads email tracking pixels before a recipient opens the message, inflating reported open rates by approximately 15–25 percentage points. Marketers should filter machine-triggered opens and rely on CTR and CTOR for accurate engagement measurement.
What is the average email open rate across all industries?
The weighted average email open rate across 38 industries is 31.4%, based on 32 million email sends analyzed from january 2024 through march 2026.
Why do some industries have much higher open rates than others?
Sectors like charity, government, and education send to self-selected audiences with a strong relationship to the sender, which drives higher open rates. Retail and B2B SaaS typically send to larger, less engaged lists, which pulls their averages down.
Can a high open rate mean poor campaign performance?
Yes. The wedding sector reports open rates above 52% but conversion rates as low as 0.04%. Open rate measures initial interest, not purchase intent or revenue, so it must be read alongside conversion data to assess true campaign performance.